By Jack Calderon, Chaim Lubin
 In the second quarter of 2010, the index of solar companies tracked by global investment bank Lincoln International (the Solar Stock Index) underperformed the S&P 500. The Solar Stock Index declined almost 20%, while the S&P declined approximately 12%. In the second quarter of 2010, the index of solar companies tracked by global investment bank Lincoln International (the Solar Stock Index) underperformed the S&P 500. The Solar Stock Index declined almost 20%, while the S&P declined approximately 12%.
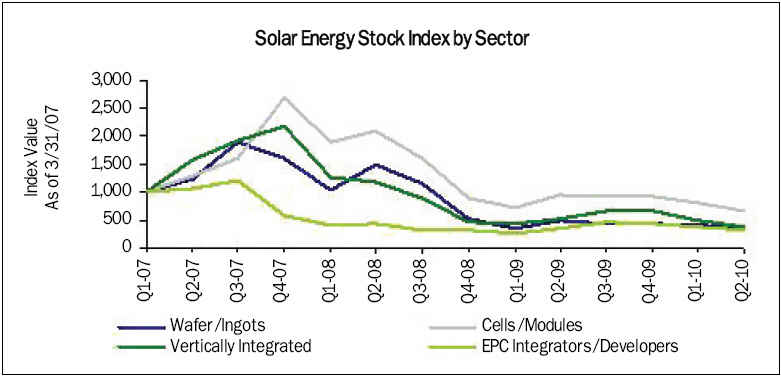
The Solar Stock Index covers four main sectors within the solar industry: Wafers and Ingots Producers (Wafers/Ingots), Cells and Modules Manufacturers (Cells/Modules), Solar Engineering, Procurement, and Construction Integrators and Developers (EPC Integrators/Developers) and Vertically Integrated Companies (Vertically Integrated). Each sector captures a specific aspect of the overall solar energy value chain and is an integral part of the industry. Every sector covered by the Solar Stock Index declined during the second quarter of 2010. The Wafers/Ingots sector declined the least, only dropping approximately 7% on average, while the Vertically Integrated companies performed the worst, falling almost 24% on average. Cells/Modules and EPC Integrators/Developers decreased 20% and 16%, respectively.
.jpg)


.jpg)
.jpg)
Declines in the stock prices of companies within the Solar Stock Index have driven down industry valuation multiples. Understanding the Earnings before Interest, Taxes, Depreciation, and Amortization (EBITDA) multiples of the companies in the index (calculated by taking the ratio of enterprise value to EBITDA of each respective company) can help provide approximate values of businesses operating in these sectors. Higher multiples can indicate the attractiveness of a sector or business.
Currently, the Cells/Modules sector is exhibiting the highest EBITDA multiples at 12.6x on average, while Wafers/Ingots companies are trading lower than any other sector in the solar industry at an average of 7.0x. EPC Integrators/Developers and Vertically Integrated companies are exhibiting EBITDA multiples of 7.4x and 10.3x on average, respectively. These multiple levels are among the lowest the solar industry has exhibited; historical multiple values for certain sectors have reached above 20.0x in the past.
.jpg) Despite valuation declines, the solar landscape is demonstrating positive financial attributes. The growth of solar companies during the last three years has been quite significant, with Compound Annual Growth Rates (CAGR) of all four sectors exceeding 30% for this time period. In addition, profitability has improved across the industry. This is illustrated by the quarter-over-quarter increase in average EBITDA margins of all four sectors. Despite valuation declines, the solar landscape is demonstrating positive financial attributes. The growth of solar companies during the last three years has been quite significant, with Compound Annual Growth Rates (CAGR) of all four sectors exceeding 30% for this time period. In addition, profitability has improved across the industry. This is illustrated by the quarter-over-quarter increase in average EBITDA margins of all four sectors.
At the front of the supply chain, the EBITDA margins of Wafers/Ingots companies increased from an average of 2% at the end of the first quarter of 2010 to approximately 20% on average by the end of the second quarter of 2010. In addition, the Cells/Modules sector has seen EBITDA margins increase from an average of approximately 3% at the end of the first quarter of 2010 to averaging above 12% at the end of the second quarter of 2010. EPC Integrators/Developers are now back in the black with EBITDA margins averaging approximately 9%, as compared to the end of the first quarter when the average for this sector was negative. The EBITDA margins of Vertically Integrated companies improved slightly from an average of 12% to 14% quarter-over-quarter.
Although the solar industry is still young, it is showing signs of maturity as companies strategically focus their business models and capture needed scale from consolidation efforts. These trends will help drive top-line growth which, combined with the improvements in profitability, could mark a real turning point for valuations in the solar industry.
Jack Calderon is Managing Director at Lincoln International (http://www.lincolninternational.com/) and co-heads the firm’s Renewable Energy Group. Chaim Lubin is an associate at Lincoln International and a part of the Renewable Energy Group.
For more information, please send your e-mails to pved@infothe.com.
ⓒ2010 www.interpv.net All rights reserved.
|


.jpg)