A real-time experience from the field
The increasing recognition and demand for the quality standards in the PV industry by the end users, ranging from small consumers to large financial institutions, places strict requirements on manufacturing practices that have never been more important than they are today. When PV modules fail in the field, there is an opportunity to determine the mode of failures and adjust manufacturing practices to minimize such failures. This, in turn, provides an opportunity to assess the failure rate that a given manufacturer could expect based on both historical data and forward-forecasting for the guaranteed lifetime. While historical failures are simple to understand, forward prediction is complex and poorly understood. This article presents an approach to predict the expected failure returns for the entire life period of a solar module based on actual failure returns data from the field.
By Bypina Veerraju Chaudary, MHB Stowell, Baskara Pandian, Yang Xiaowu, Jacky Duan
.jpg)
By definition, PV module certification is simply based on conformance to the standards. The IEC norms for the PV modules are considered to be adequate quality requirements for guaranteeing initial quality.1) When conforming to these standards, PV modules are expected to have a guaranteed lifetime of 25 years or more at appropriate power degradation as designated by the manufacturers. In the past, the introduction of feed-in tariffs for the PV systems through government-backed subsidy programs helped attracting investments in PV. However, with the recently announced continuous FiT cuts in almost all major markets, there is an obvious urgency among all manufacturers to drive the costs of solar modules down in order to be competitive in the market. The demand for lower prices has led much of the PV industry manufacturing to relocate to developing countries, in particular, China which today accounts for more than 50% of global production volumes. With over 700 PV manufacturers ranging from private-owned small businesses, making a few thousands of kilowatts to publicly-traded companies producing gigawatts of PV modules. In this context, distributors, EPC contractors, developers, installers and end users are witnessing a flood of products with varying standards of quality and it is a daunting task to select a manufacturing partner who can meet the stringent manufacturing quality demanded for PV module installations with lifetimes exceeding 25 years.2) These stringent demands require tight manufacturing quality controls that can control not only finished product quality and failures but most importantly can control potential failures in the field installation. The ability to forward forecast and predict potential field failures as a result of certain manufacturing practices is a critical task in determining the actual failure rate that a manufacturer can truly guarantee.
Failure Analysis
Like any other products, solar modules also follow the well-understood ‘bath tub’ curve when they are being discussed under the context of failure and/or reliability analysis. In a more generalized principle, the modules experience 3 stages of behavior during their passage in time. Stage 1 refers the ‘infantal mortality’ cases where the initial failures are usually being high and decreases over time. Stage 2 refers the ‘normal life period’, the stage where the defects rate usually stays constant while the final stage refers the ‘wear out period’ which usually happens after 25 years at the end of life of solar modules provided they are operated in a way that they should be. Having understood the facts that the behavior is similar to other products, it is also not difficult to realize that the similar kind of statistics could be applied to predict the failure rate over time as in the case of products in any other industry. Utilizing this concept, the WEIBULL Statistics could be used to predict the failure rate over time using real failure returns data from the field. The Weibull distribution is one of the most widely used lifetime distributions in reliability engineering. It is a versatile distribution that can take on the characteristics of other distributions commonly known, based on the value of shape parameter (ß) which is also known as slope parameter (as ß is the slope in the line regression chart of Ln(Age) Vs Ln[Ln(R(t))], will be discussed in later). In more generalized cases, a two parametric Weibull Statistic based on the Scale parameter (η) and Shape parameter (β) is appropriate enough, omitting the location parameter (γ). The probability density function then takes the form
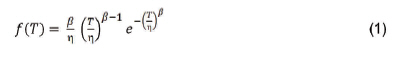
The Weibull Reliability function could be derived from the above and is defined as

The Weibull Failure rate function λ(T) is the ratio of Probability Density Function f(T) to Reliability Function R(T) and is given as

Thus, the above equation requires the parameters ß and η to be determined for the estimation of failure rate over time.
Parameters Estimation
Had it been the case of complete data set where every element under observation fails after certain time or the event of interest could be observed, it could have been quite easier to estimate the required parameters using a simple line regression method based on Mean Order Rank (MOR) methodology. However, in real scenario, the deployment of usually a huge number of modules in the field with only a tiny fraction usually being observed deaths when others are cranking power, operating normally and other cases of drop-outs, move-away, limits the use this approach. In this case, the dataset becomes incomplete and requires suitable data suspension that depends on the time interval on which each event is recorded. For the suspended datasets, a Kaplan-Meier life table is effective in estimating the survival probability of each element under consideration and its reliability score. The derived reliability could be then used to estimate the parameters ß and η.
Methodology
For our analysis, we have taken our five- year long historic data, from year 2007 to Jul 2011, arranged month wise. The actual failure returns from the field are recorded at their life been spent in the field, again in units of month. A life data table is then created with proper counting of ‘at-risks’ and ‘withdrawn’ cases using these real data from the field and the above discussed analysis was applied over it to estimate the required parameters. In all our analysis, in order for a proper time accounting we have assumed a 2 month install period which counts form the date of shipment, as most times we have no reference on the actual installation date.
Results and Discussion
.jpg)
Figure 1 is the result of the analysis based on the real life table data that is fitted on the straight line using the line regression method. The predicted straight line is the best fit to the observed values and represents the maximum likelihood for the parameters estimation. The slope of the line (β) is the interested parameter which defines the shape of the characteristics distribution. In our analysis, the β resulted is 0.4585 which is less than 1 and represents the Stage 1, ‘infantal mortality’ case, the burn-in early failures showing the characteristic of decreasing failures rate as the time pass-by. The data points on the extreme right corner range from Ln(Age) 3 to 4 stays constant indicating there was no failures recorded in this interval and the reliability score is simply high. It is important not to omit these points even when no failures were observed as these points take important role in determining the slope of the line and the ultimate failure rate prediction.
The other parameter that required is the Scale parameter (η), is the measure of spread or scale in the distribution of data. A simple mathematical rearrangement estimates η equals 3.15 X 10¹⁰ in our analysis. This corresponds to a reliability score of 99.98% at 25 years.
.jpg)
The above estimated parameters are then applied in equation (3) and the result is given in Figure 2. As suggested by the less than 1 beta value, we can observe a decreasing failure rate over time. The initial higher failure rate, as discussed previously, refers the burn-in failures, the typical infantal mortality case.
The estimation of parameters ß and η opens many possibilities not only in predicting the failure rate over time but also to estimate the likely cumulative defective rate at modules warranty expiry line. Figure 3 shows the cumulative expected failure rate over 25 years. The Defective Parts Per Million (DPPM) based on our real data inputs thus amounts to 192DPPM at end of 25 years which is well below the generally accepted industry average and refers to the process sigma value of 5.8.
.jpg)
Also shown in Figure 3 are the 90% confidence intervals bound indicates a risk 10% observations going wrong which we are prepared to accept. By all means, the cumulative DPPM is expected to be in the range of 100-450 DPPM after 25 years at 90% confidence level.
Not referring to the IEC standard tests, we generally classify all the failure modes that happen with the solar modules in the field in 8 failure modes related to interconnects, solder bonds, encapsulate lamination, metallization corrosion, cell crack or break, glass break and hot spots. The quality tools such as FMEA and Pareto are useful in identifying the vital modes, capturing the maximum occurrence of the defects but do not provide information on the failure modes behavior with time. The failure modes that are explained by only their maximum occurrences may not be adequate in this case for suitable containment actions. Extending the above discussed analysis for studying, each failure modes individually, their behavior with time would strengthen the analysis further and lead us to take the right actions.
It has been shown that the cumulative failure rate of solar modules at their end-of-lives could be predicted using Weibull statistics and a Kaplan-Meier life table could be used to estimate the maximum likelihood of required parameters ß and η. Based on our historical data on the supplied quantities of solar modules and the recorded failure returns, we estimated to have a decreasing failure rate over time. The cumulative failure rate after 25 years is expected below the industry acceptable levels. It is also concluded that similar kind of analysis could be extended to cover each defects in depth for a suitable course of containment actions.
Bypina Veerraju Chaudary is the Chief Technology Officer (CTO) and Chief Operating officer (COO) for CNPV Solar Power. He has over 21 years of extensive experience in solar PV manufacturing and technology. At this position, he is taking overall responsibility including Business Development, Sales, Marketing, Supply Chain, Technology, Operations, Corporate Strategy and also focuses on strengthening corporate relationships and developing strategic partnerships. He has proven himself to be a leader and model of achievement through his vast experience, hard work and dedication. Chaudary holds a Bachelor’s Degree in Electronics Engineering from Andhra University and also trained in Solar Photovoltaic System Design and Engineering from the renowned Indian Institute of Technology (IIT), Mumbai, India, which is arguably one of the best technical schools in the world.
REFERENCES
1) Alexander Preiss, Stefan Krauter, Michael Schoppa, Ilka Luck, Aug 2011, PV Module Testing―how to ensure quality after PV Module Certification, Photovoltaics International
2) Thibaut Lemoine, Aug 2011, Assessing the real quality of PV modules, Photovoltaics International
For more information, please send your e-mails to pved@infothe.com.
ⓒ2011 www.interpv.net All rights reserved. |