Since a number of years, PV is one of the fastest growing industries with growth rates well beyond 40% per annum. This growth is driven not only by the progress in materials and processing technology, but by market introduction programs in many countries around the world and the increased volatility and mounting fossil energy prices. Despite the negative impacts of the economic crisis in the first half of 2009, PV is still growing at an extraordinary pace.
BY Arnulf JAger-Waldau

PV Production
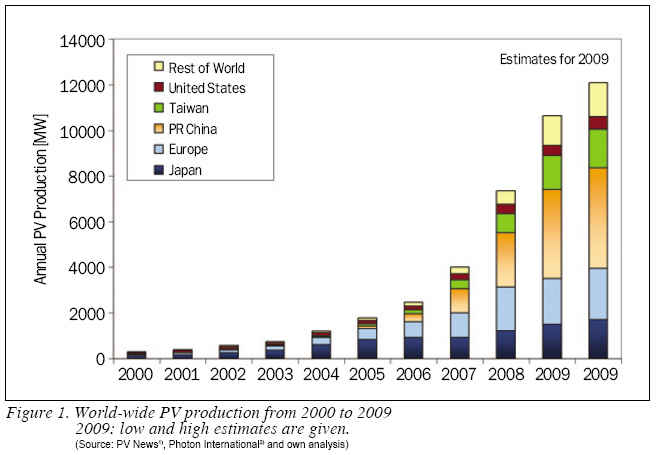
Production data for the global cell production* in 2009 vary between 10.5 GW and 12 GW (see Figure 1), which is again an increase of 40% to 50% compared to 2008. The significant uncertainty in the data for 2009 is due to difficult market situation, which was characterized by a declining market environment in the first half of 2009 and an exceptional boom in the second half of 2009.
In addition, the fact that some companies report shipment figures, whereas others report production figures add to the uncertainty. The difficult economic conditions added to the decreased willingness to report confidential company data. Nevertheless, the figures show a significant growth of the production as well as an increasing silicon supply situation.
The announced production capacities--based on a survey of more than 300 companies worldwide--increased despite difficult economic conditions. Despite the fact that a significant number of players announced a scale back or cancellation of their expansion plans for the time being, the number of new entrants into the field, notably large semiconductor or energy related companies overcompensated this. At least on paper the expected production capacities are increasing. Only published announcements of the respective companies and no third source info were used. The cut-off date of the used info was April 2010.
It is important to note, that production capacities are often announced, taking into account different operation models such as number of shifts, operating hours per year, etc. In addition, the announcements of the increase in production capacity do not always specify when the capacity will be fully ramped up and operational. This method has, of course, the setback that a) not all companies announce their capacity increases in advance and b) that in times of financial tightening, the announcements of the scale back of expansion plans are often delayed in order not to upset financial markets. Therefore, the capacity figures just give a trend, but do not represent final numbers.
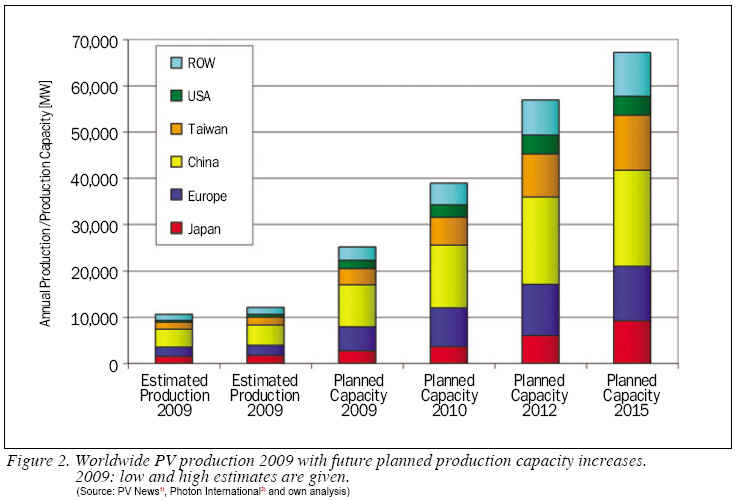
If all these ambitious plans can be realized by 2015, China will have about 31% of the worldwide production capacity of 67 GW followed by Europe (18%), Taiwan (18%) and Japan (14%). See Figure 2 3),4).
All these ambitious plans to increase production capacities at such a rapid pace depend on the expectations that markets will grow accordingly. This, however, is the biggest uncertainty as can be seen with the market estimates for 2010 which vary between 7.5 GW and 13.7 GW. In addition, most markets are still dependent on public support in the form of feed-in tariffs, investment subsidies or tax-breaks.
Already now, electricity production from photovoltaic solar systems has shown that it can be cheaper than peak prices in the electricity exchange. In April 2010, solar photovoltaic electricity system prices as low as €2,300 for small residential systems (up to 5 kWp) are a reality. With such investment costs, the electricity generation costs are already at the level of residential electricity prices in some countries, depending on the actual electricity price and the local solar radiation level. But only if markets and competition will continue to grow, prices of the photovoltaic systems will continue to decrease and make electricity from PV systems for consumers even cheaper than from conventional sources. In order to achieve the price reductions and reach grid-parity for electricity generated from photovoltaic systems, public support especially on regulatory measures will be necessary for the next decade.
Technology Mix
Wafer-based silicon solar cells is still the main technology and had around 80% market shares in 2009. Polycrystalline solar cells still dominate the market (45% to 50%) even if the market shares are decreasing since 2003. Commercial module efficiencies are within a wide range between 12% and 20%, with monocrystalline modules between 14%-20% and polycrystalline modules between 12%-17%. The massive capacity increases for both technologies are followed by the necessary capacity expansions for polysilicon raw material.
In 2005 production of thin-film solar modules reached for the first time more than 100 per annum. Since then the Compound Annual Growth Rate (CAGR) of thin-film solar module production was even beyond that of the overall industry increasing the market share of thin-film products from 6% in 2005 to 10% in 2007 and 16-20% in 2009.
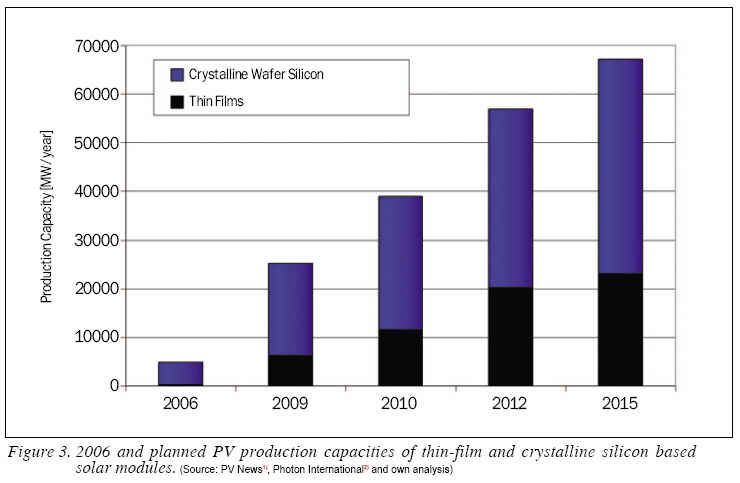
More than 150 companies are involved in the thin-film solar cell production process, ranging from R&D activities to major manufacturing plants. The first 100 thin-film factories became operational in 2007. If all expansion plans are realized in time, thin-film production capacity could be 20.2 GW or 36% of the total 56.9 GW in 2012 and 23.0 GW or 34% in 2015 of a total of 67.2 GW. See Figure 3. The first thin-film factories with GW production capacity are already under construction for various thin-film technologies.
One should bear in mind that only one fourth of the over 150 companies have already produced thin-film modules on a commercial scale in 2009.
More than 100 companies are silicon-based and use either amorphous silicon or an amorphous/microcrystalline silicon structure. 30 companies announced to use Cu (In,Ga)(Se,S)2 as absorber material for their thin-film solar modules, whereas 9 companies use CdTe and 8 companies go for dye & other materials.
Concentrating Photovoltaics (CPV) is an emerging market with approximately 17 MW cumulative installed capacity at the end of 2008. There are two main tracks--either high concentration >300 suns (HCPV) or low to medium concentration with a concentration factor of 2 to approx. 300. In order to maximize the benefits of CPV, the technology requires high Direct Normal Irradiation (DNI) and these areas have a limited geographical range--the ‘Sun Belt‘ of the Earth. The market share of CPV is still small, but an increasing number of companies are focusing on CPV. In 2009 about 30 MW CPV were cumulative installed, but market predictions until 2014 estimate annual growth rates between 35% to 40%.
PV Markets
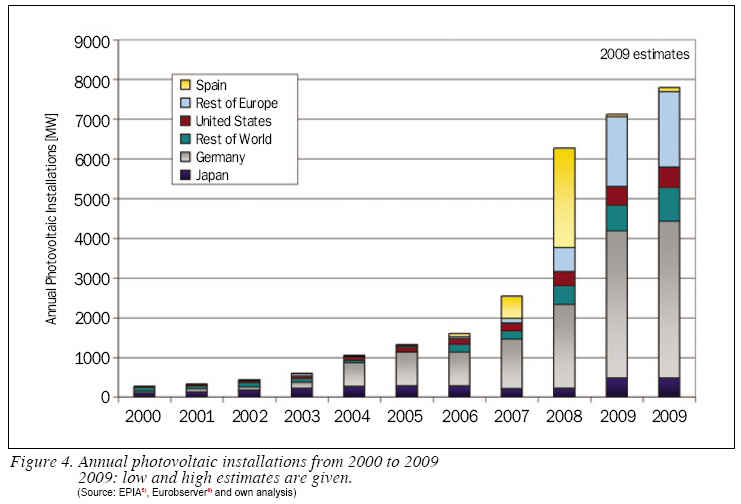
After a year of speculations about a contracting or increasing photovoltaic market, the latest market estimates came as a surprise for most people. The current estimates are between 7.1 GW and 7.8 GW, as reported by various consultancies. See Figure 4. One could guess that this represents mostly the grid-connected photovoltaic market. To what extent the off-grid and consumer product markets are included is unclear.
After a slow start, the markets began to pick up pace in the second quarter, but the real boom happened in the last quarter when in Germany alone, according to the German Federal Network Agency, 1.46 GW of new capacity were added.
With a cumulative installation of 9.8 GW, Germany has about 45% of the total worldwide 22 GW of solar photovoltaic electricity generation capacity at the end of 2009. The boom in the German market is attributed to the 10% cut of the feed-in tariff, which took effect on 1 January 2010 and the ongoing discussions about a further substantial cut during 2010.
In 2009, the German market was the biggest with estimates in the range of 3.7 GW to 4 GW, followed by Italy with an added capacity of about 700. Further development of the market will depend on the new Conto Energia which is due to be announced in the spring of 2010.
The U.S.A followed with new installed capacities estimated between 470 MW and 510 MW. At the moment, Power Purchase Agreement Applications with a two digit GW capacity are in the permitting stage, but it is assumed, that only a part of them will be actually realized of the next few years.
The Japanese market showed a strong performance with 484 MW newly installed capacity. In 2009, more than double of new capacity than in 2008 was added thanks to a revitalization of the market by an investment incentive of ¥70,000 per kW for systems smaller than 10 and the new surplus power purchase scheme with a purchase price of ¥48 per kWh from systems smaller than 10 kW.
The strong market in the Czech Republic with more than 400 newly installed photovoltaic systems is expected to decline in the near future, especially from 2011 on, after significant cuts in the very attractive feed-in tariff were announced in the spring of 2010.
After a strong 2009 market performance in Belgium (290 MW) and France (285 MW installed, but about 100 MW not connected) it is expected that the growth will slow there due to the revisions to the financial support schemes early 2010.
In Spain, the 2008 champion, only about 60 to 100 MW were newly installed in 2009, due to the setup of a market cap and the effects of the financial crisis. Greece, Portugal and the United Kingdom are showing an interesting potential for growth in 2010.
Canada and Australia emerged as new markets in the 100 MW size range and are expected to emerge even stronger in 2010.
Despite the fact that the Chinese PV market more than doubled in 2009 to approximately 100 MW, the home market is still less than 3% of total photovoltaic production. This situation might change because China‘s RMB 4 trillion stimulus package, which was announced in early March 2009, includes RMB 210 billion (€22 billion: Exchange rate: €1 = 9.5 RMB) for green energy programs. Analysts believe that these measures will accelerate the Chinese domestic market. China is now aiming for 2 GW solar capacity in 2011 and in July 2009 under the new energy stimulus plan, China revised its 2020 targets for installed solar capacity to 20 GW.
The 2009 market estimates for India were in the 100 MW range. The fact that the Indian Union Government approved the National Solar Mission in November 2009 should give further impetus to the markets. The National Solar Mission aims to make India a global leader in solar energy and envisages an installed solar generation capacity of 20 GW by 2020, 100 GW by 2030 and 200 GW by 2050.
After the exceptional year 2008 where almost 300 MW were installed in South Korea, the market contracted to about 100 MW in 2009 due to the reaching of the cap. In Asia, Taiwan and Thailand are interesting emerging markets as well.
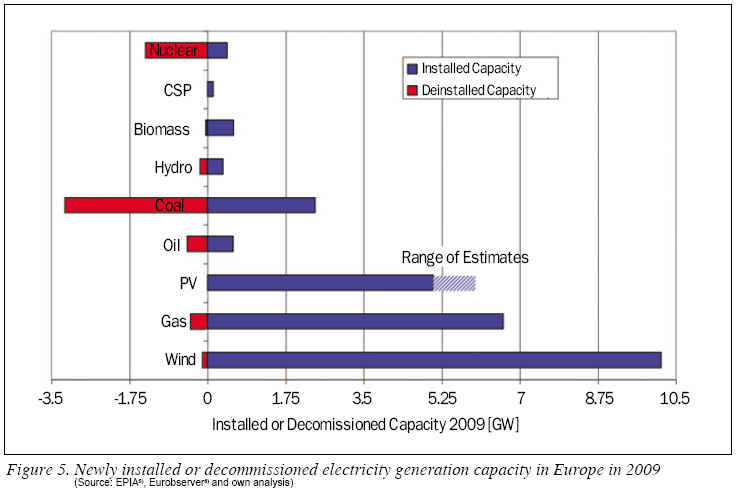
Last but not least, it is worthwhile to point out that for the second year in a row the newly installed capacity of solar photovoltaic electricity systems in Europe was only third to wind and gas. See Figure 5.
Risk and Opportunity
The increase of conventional energy prices has increased the investment attention for renewable energies and in particular photovoltaics significantly. Despite the difficult economic conditions, the world wide production continued to increase with growth rates above 40%. There is a dynamic growth rate in system installation, but due to the tremendous capacity increase production surplus will continue to exist at least for the next two to three years. This development is connected to an increasing industry consolidation, which presents a risk and an opportunity at the same time. If the new large solar cell companies use their cost advantages to offer lower-priced products, customers will buy more solar systems and it is expected that the PV market will show an accelerated growth rate. However, this development will influence the competitiveness of small and medium companies as well. To survive the price pressure of the big and financial strong companies, they have to specialize in niche markets with high value added in their products. The other possibility is to offer technologically more advanced and cheaper solar cell concepts.
Electricity production from PV solar systems have already shown now that it can be cheaper than peak prices in the electricity exchange in a wide range of countries and if market growth continues at the current pace, electricity generation cost with photovoltaic systems will have reached grid parity in most of Europe by 2020. In addition, solar photovoltaic generated electricity offers, contrary to conventional energy sources, a reduction of prices rather than an increase in the future.
Dr. Arnulf Jger-Waldau is a Scientific Officer and Senior Scientist at the Renewable Energy Unit, Institute for Energy of the European Commission‘s Joint Research Centre since 2001. He works on the assessment of renewable energy technologies, the effectiveness of their implementation and their integration into energy infrastructures. (www.jrc.ec.europa.eu)
[REFERENCES]
* Solar cell production capacities mean:
- In the case of wafer silicon based solar cells only the cells- In the case of thin-films, the complete integrated module
- Only those companies which actually produce the active circuit (solar cell) are counted
- Companies which purchase these circuits and make cells are not counted.
1) PV News 2008, published by The Prometheus Institute, ISSN 0739-4829
2) Photon International, March 2008
3) Company Web-sites and Press Releases
4) Data received from Companies during personal visits.
5) European Photovoltaic Industry Association, Global Market Outlook for Photovoltaics until 2013, 2009
6) Photovoltaic Energy Barometer, Systmes Solaires, le journal du photovoltaique no 1--2009, March 2009, ISSN
For more information, please send your e-mails to pved@infothe.com.
ⓒ2010 www.interpv.net All rights reserved.
|